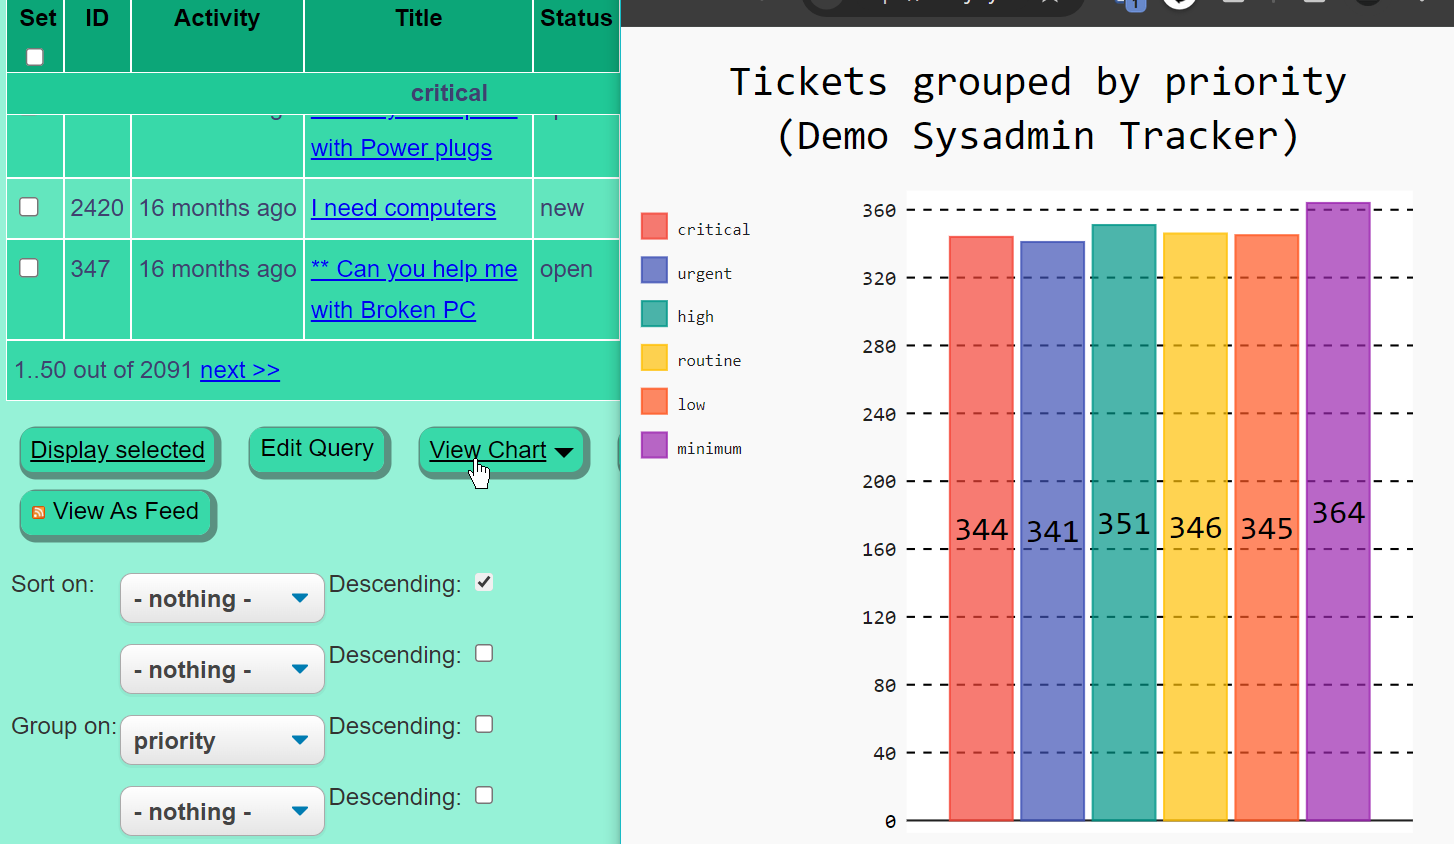
The index page for the Roundup Issue Tracker displays a table of data. The data can be sorted and grouped by various properties. Currently there is minimal support for generating drill down charts from these index tables. Existing examples display the chart in a separate window. The chart should be displayed surrounded by the page template. Currently only one level of grouping is used to segment the chart. If you group by priority and then user, a bar chart with the count of tickets by priority is shown. Ideally, you should see a grouped bar chart where there is one priority bar for each user.
Details
The Roundup Issue
Tracker has a tabular display of search results. This can be
downloaded as CSV to produce reports. However, providing simple drill
down charts within Roundup is feature that enhances the user's
capabilities.

The current code is a proof of concept and needs to be better integrated into the Roundup tracker application. The following areas need to be addressed:
- Display of the chart should be in the same page that was used to generate it. This will require some changes to the HTML templates as well as some changes to the underlying Python code that turns the index page into a chart.
- The index page can be grouped by multiple facets/properties. However the charting only supports one level of grouping. Charts should be extended to support at least two grouping levels using: grouped bar chart, multi-series pie, or treemaps. Pygal (the underlying chart package) has other charts that may be more suitable for higher order grouping.
- Currently it only supports bar and pie charts. Additional charts including histogram, box, line, scatter, or composite charts to better visualize the index table would be welcome.
- Creating a menu/web component to trigger and customize a chart is a possible extension of this project
The goal of this is to update the current wiki page with the changes needed to implement the features above.
Skills/Technologies Required/Excluded
- Python 3
- Jinja2 templating
- TAL templating using the the Zope Zope Template Attribute Language
- HTML
- SVG
- Some vanilla JavaScript
Resources
- Roundup Issue Tracker Documentation
- Older example code for producing charts. Newest code also supports barcharts.
- Live example. Use the "View chart" menu Button.
- Command line chart generation
- Errata for released documentation. If you are installing on windows, read this first.
- Pygal charting library
- Go Make Things web development toolkit - JavaScript templates and techniques. Author is also "the vanilla JavaScript guy".